results
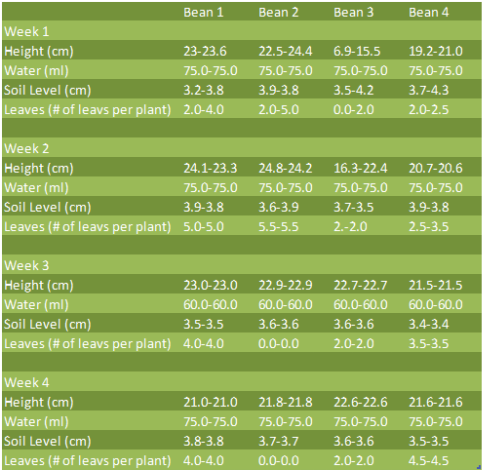
*There are two sets of data for each column per week because I collected data twice a week for each group.*
Control Group Data:
Control Group Data:
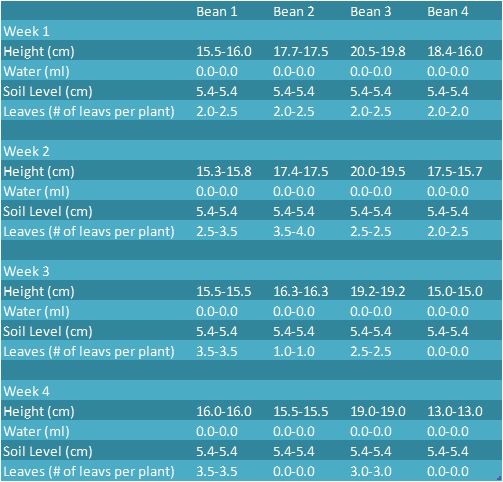
Experimental Group Data:
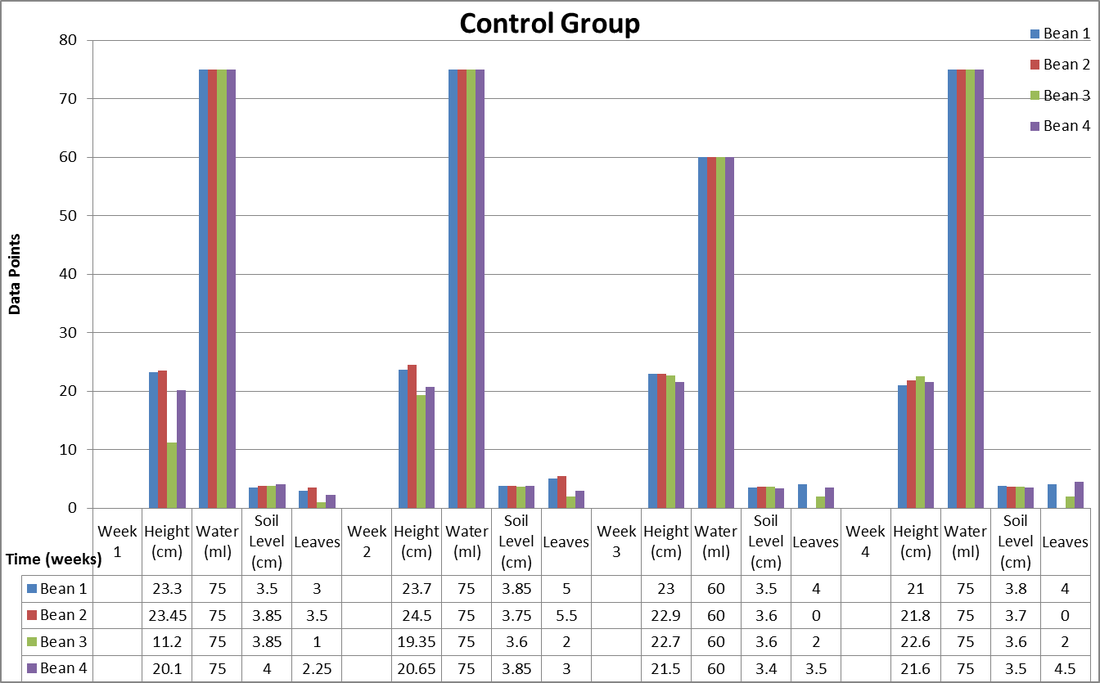
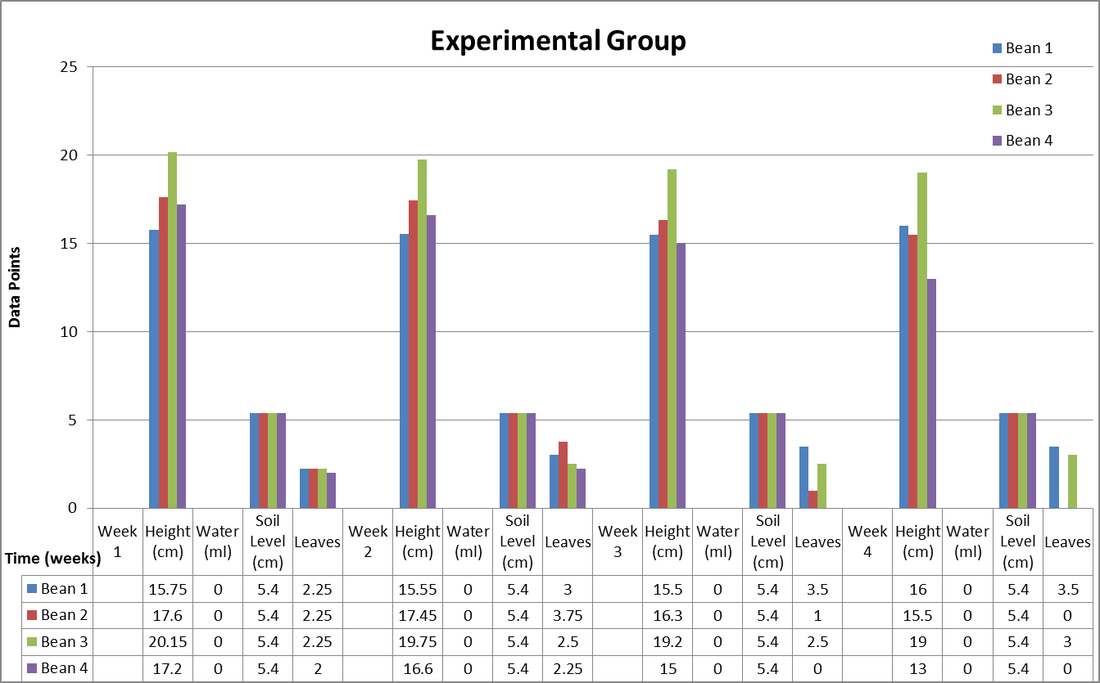
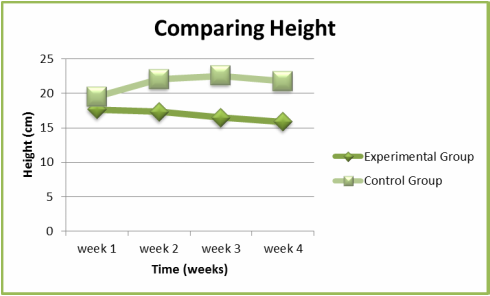
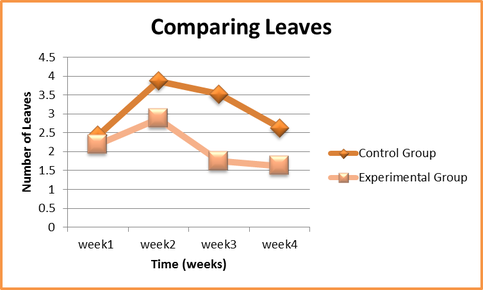
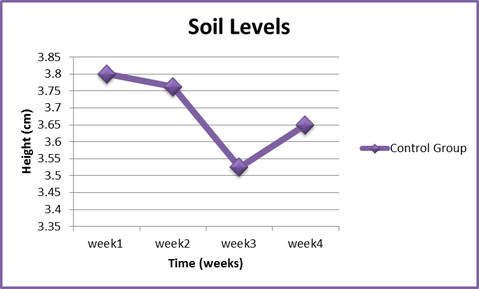
The data for each graph is averaged per week in order to express my data in a clear way.
The data for these three graphs is an average of the four plants from the two groups to show the general trend of the categories.
Analysis
When comparing the data it can be seen that towards the end of the experiment some plants from both the control and experimental groups are dying because of the loss of leaves and physical height of the plants. The height of the plants from the experimental group have a decreasing trend from the beginning, where the height of the control group plants appear to have the trend of increasing then decreasing after two weeks. The number of leaves on each plant from both groups show a trend of increasing then decreasing. Also the soil level from the control group decreased over time, the experiment group stayed constant because the growing medium was not being washed away. The amount of water added for the control group remained constant except during week 3 when water given was decreased. The amount of water added to the experimental group is zero because after filling the water reservoir there was no need to continue adding water to the tank.
